
Quant Dividend Grades
Dividend Security Is Achieved By Investing In Stocks That Provide Dividend Safety And Dividend Growth
Seeking Alpha Dividend Grades can preserve your capital and keep you on track with your income goals. Two critical elements for this objective are Dividend Safety Grades and Dividend Growth Grades. Seeking Alpha now provides subscribers with these next-gen quant investment research tools to help minimize dividend risk and improve dividend growth returns.
Here’s How Our Dividend Safety Grades Work
Since 2010, Seeking Alpha’s Dividend Safety Factor Grade Has Demonstrated Accuracy At Avoiding - Or Predicting - Dividend Cuts
99% of Dividend Cuts Averted By Owning Stocks With Dividend Safety Grades from ‘A+ to A-’
98.1% of Dividend Cuts Averted By Owning Stocks With Dividend Safety Grades from ‘A+ to B-’
91.3% of all stocks that CUT their Dividend had a dividend safety grades ‘C+’ or Lower (C+ to F)
60.33% of all stocks that had a Dividend Safety Grade of ‘F’ CUT their Dividend
- - -
Date: 2010-2026
Source: S&P Global and Seeking Alpha
Seeking Alpha’s Dividend Scorecard and Grading System can identify stocks at potential risk of cutting their dividends and is an excellent tool that forewarns investors of dividend hazards.
The Dividend Safety quant recommendations represent the culmination of powerful computer processing and ‘Data-Driven’ analysis. The backtest trading strategy shows the effectiveness of our Dividend Safety grades.
Our proprietary system scores important dividend metrics which our model predicts will have the best relative safety compared to other dividend paying stocks. Seeking
Seeking Alpha’s Dividend Grades can provide an instant characterization of each stock's dividend strength or weakness compared to its sector. Indicators like payout ratios, dividend coverage ratios, interest coverage ratios, debt ratios, profitability metrics, and weak cash per share figures can flag when a dividend is at risk.
Here’s How Our Dividend Growth Grades Works
Seeking Alpha's ‘Strong Buy’ Dividend quant ratings are the result of powerful computer processing and our special ‘Quantamental’ analysis.
From nearly all U.S. securities with dividends, our quant algorithm picks stocks with the strongest dividend growth metrics vs. the peer sector.
These attributes are assigned grades that are then weighted to maximize the predictive value. The best dividend growth stocks are awarded an ‘A+’ grade.
Over the last 12 years, the backtested strategy has delivered very impressive returns, beating the Vanguard Dividend Appreciation ETF (VIG).
What’s more, if we look at the performance since January 2010 onwards, our ‘A+’ Dividend Growth stock picks have delivered a staggering return, as you can see above.
To see our current ‘Strong Buy’ Dividend Growth stocks, go to Top Quant Dividend Stocks. This screener automatically highlights the best-ranked dividend paying quant stocks. You can also filter by multiple metrics to pinpoint the most suitable stocks for your investing strategy.
Check out the Dividend Grades on your stocks, or evaluate new ideas, to make sure you stick with dividend income that is strong, safe, and stands to increase over time.

Source: S&P Global via Seeking Alpha Premium
Seeking Alpha’s Quant Dividend Grades provide an instant characterization of each stock’s dividend strength or weakness compared to its relative sector. Dividend Safety measures profitability and leverage metrics. The Yield Grade measures historical and consensus estimated yield. Dividend Growth measures historical and estimated growth rates. Dividend Consistency measures how consistently the company has paid a dividend and raised its dividend. In combination, the Dividend Grades help investors assess if the dividend is safe and if income will be stable, increase, or decrease.
FAQs
-
The advantage for investors is the effectiveness of our dividend quant methodology. The principal of the strategy is to provide an instant characterization that measures each stock’s dividend strength or relative to its sector.
The purpose of exhibiting the performance of all the Strong Buy stocks with ‘A+’ dividend growth grades since inception is to highlight the success of the strategy. As you can see from the chart above, Seeking Alpha’s proven track record is very strong and very long. The purpose of exhibiting the dividend safety factor grade history is to demonstrate the accuracy at avoiding - or predicting - dividend cuts.
-
Backtesting reveals how well a specific trading strategy would have performed in the past using historical data. The backtest and model is not an investable product as it only reflects the strategy’s historical performance - but it does let you analyze risk and past profits before allocating real capital. Typically, a full stock market cycle is 4-5 years.
The backtesting proves the effectiveness of our trading methodology employing ‘Strong Buy’ stocks with ‘A+’ dividend grades.
Seeking Alpha’s dividend growth market performance is based on a backtested hypothetical portfolio of all the daily ‘Strong Buy’ ratings from January 2010 through March 2026.
-
Seeking Alpha's Very Bullish recommendations are generated daily by a systematic quantitative model with no human intervention. The backtested return does NOT reflect an actual portfolio from an investment product. The return is from a backtested, hypothetical portfolio of all stocks ranked Strong Buy by Seeking Alpha on a daily basis, from January 2010 through March 2026.
Seeking Alpha's Strong Buy recommendations with dividend growth grades of ‘A+’ were equally weighted, inclusive of paid dividends, rebalanced daily, with zero transaction costs. Commissions and transaction costs would lower the return of an actual portfolio. Seeking Alpha backtested trades were uploaded to a portfolio and performance attribution system owned by S&P CapIQ. The returns are generated and calculated by the S&P CapIQ portfolio and performance attribution system. The benchmark in this table is the VIG ETF. The VIG returns in this table are for the same time period, January 2010 through March 2026.*Past performance is no guarantee of future results. Therefore, you should not assume that the future performance of any specific investment or investment strategy will be profitable or equal to corresponding past performance levels. Inherent in any investment is the potential for loss. This material is being provided for informational purposes only and nothing herein constitutes investment, legal, accounting or tax advice, or a recommendation to buy, sell or hold a security. No recommendation or advice is being given as to whether any investment is suitable for a particular investor. It should not be assumed that any investments in securities, companies, sectors or markets identified and described were or will be profitable. Seeking Alpha is not a fiduciary by virtue of any person’s use of or access to the website. You alone assume the sole responsibility of evaluating the merits and risks associated with the use of the information on the website before making any decisions based on such information or other content. Any views or opinions expressed may not reflect those of the firm as a whole. Seeking Alpha is not a licensed securities dealer, broker or US investment adviser or investment bank.
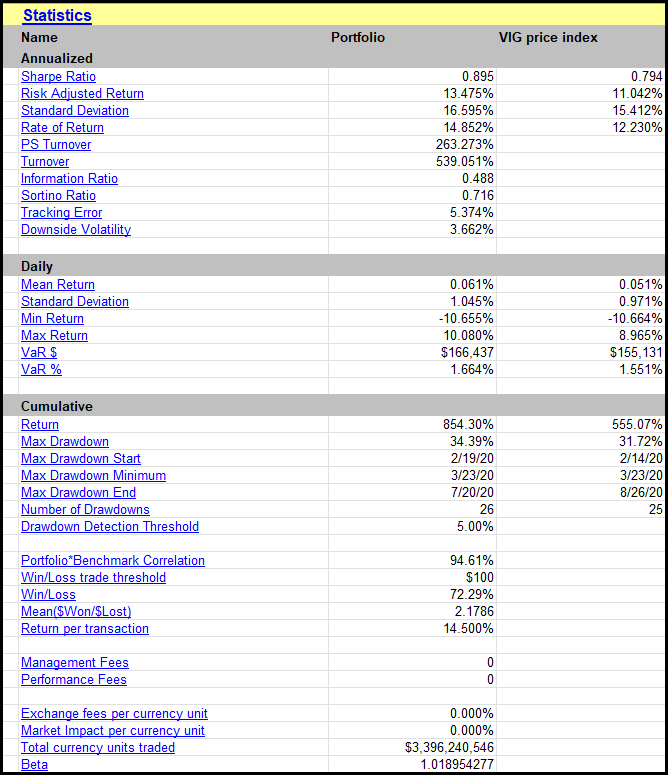
Key Performance and Portfolio Attribution Statistics January 2010 - March 2026
-
Seeking Alpha Quant Ratings. The goal of Seeking Alpha’s quant ratings is to showcase a directional Buy, Hold, or Sell rating by measuring a stock's financial metrics against other stocks on the basis of value, growth, profitability, momentum and analysts’ earnings revisions. The metrics are assigned factor grades that are then weighted to maximize the predictive value.
Seeking Alpha Dividend Grades. Seeking Alpha’s Dividend Scorecard and Grading System can identify stocks at potential risk of cutting their dividends and is an excellent tool that forewarns investors of dividend hazards. If you're looking for growing payouts, our A+ Dividend Growth stocks have the best potential in that regard. This is reflected in the performance backtest of Strong Buy stocks with ‘A+’ dividend grades.
-
The Dividend Grades and Quant Ratings are updated once a day, before the market opens.
-
The Dividend Grades and Quant Ratings and Factor Grades appear on the stock screeners, the individual symbol pages, and the financial pages. They are only available for Premium subscribers or individuals in a free trial.
To see the ratings on the symbol pages:
(1) Ensure you are logged in to the desktop website or mobile app as a paying subscriber or in the free trial,
(2) Enter the stock symbol in the search box at the top of the page,
(3) Hit Return,
(4) When you land on the symbol page, you'll see the Quant Rating and Dividend Grades on the right-hand column.
-
Seeking Alpha’s Head of Quant Strategies, Steven Cress, has over 30 years of experience in equity research, quantitative strategies and risk management. He runs a team of quantitative analysts at Seeking Alpha that maintain the system on a daily basis.
-
Survivorship Bias: This is when a stock has been delisted or acquired and is not included in the backtest results. As of May 3, 2020, we have eliminated to the best of our ability the survivorship bias from the end of 2009 to the present by adding all stocks that were delisted or acquired to the backtest through data from S&P Global.
Restatement Bias: This is when a company restates its historical financials. We have eliminated to the best of our ability all of the restatement bias from backtesting through S&P Global data.
Split Bias: This is when a company has had a historical stock split. We have adjusted to the best of our ability stock splits from 5 June 2010 - to date using S&P Global data.
Look Ahead Bias: This is when a company reports its financials at a point that was after or not available at the end of the quarter. We have eliminated the Look Ahead Bias to the best of our ability with S&P Global data.
Portfolio Reconciliation: Audit of portfolio performance and portfolio attribution to ensure the data reflected is as accurate as possible. Monthly audits are conducted on backtesting and simulated trades.
-
Seeking Alpha data is sourced from S&P CapIQ and Compustat. The backtesting tool is ClariFi, which is also owned by S&P CapIQ. Both of these entities are fully owned by S&P Global.
-
Seeking Alpha data is sourced from S&P CapIQ and Compustat. The backtesting tool is ClariFi, which is also owned by S&P CapIQ. Both of these entities are fully owned by S&P Global.
-
For more details, see Dividend Grades FAQ.
See an informative video interview with the creator of the Seeking Alpha Quant System on the Best ways to use the Dividend Grades (Video).
To dive deeper into our quant methodology, check out this article featuring more commonly asked questions: Quant Ranking and Factor Grades FAQ.
It’s also worth watching this video with the creator of the Seeking Alpha quant system on the best ways to use the Quant Rankings and Factor Grades: An Interview With The Founder Of The Seeking Alpha Quant Rating System (Video).
-
*Past performance is no guarantee of future results. Therefore, you should not assume that the future performance of any specific investment or investment strategy will be profitable or equal to corresponding past performance levels. Inherent in any investment is the potential for loss. This material is being provided for informational purposes only and nothing herein constitutes investment, legal, accounting or tax advice, or a recommendation to buy, sell or hold a security. No recommendation or advice is being given as to whether any investment is suitable for a particular investor. It should not be assumed that any investments in securities, companies, sectors or markets identified and described were or will be profitable. Seeking Alpha is not a fiduciary by virtue of any person’s use of or access to the website. You alone assume the sole responsibility of evaluating the merits and risks associated with the use of the information on the website before making any decisions based on such information or other content. Any views or opinions expressed may not reflect those of the firm as a whole. Seeking Alpha is not a licensed securities dealer, broker or US investment adviser or investment bank.