
Quant REIT Ratings
Seeking Alpha's REIT Quant Performance
View Seeking Alpha’s Strong Buy REIT Recommendations >>
Here’s how our REIT quant system works
Seeking Alpha's ‘Strong Buy’ REIT quant ratings are the result of powerful computer processing and our special ‘REIT Quantamental’ analysis.
From nearly all U.S. REITS, our quant algorithm picks REITs with the strongest collective value, growth, profitability, Risk, and price momentum metrics vs. the REIT sector.
These attributes are assigned grades that are then weighted to maximize the predictive value. The best REITs are awarded a ‘Strong Buy’ rating.
Over the last 6 years, the backtested strategy has delivered very impressive returns, beating the Real Estate Select Sector SPDR ETF (XLRE) by a significant margin.
What’s more, if we look at the performance since inception (December 2016 onwards), our ‘Strong Buy’ REIT stock picks have delivered a staggering return, as you can see above.
Seeking Alpha has added many REIT centric metrics such as FFO, AFFO, FAD, Gross Properties, and many other types of multiples and payout ratios that are specific to REITs.
To see our current REIT ‘Strong Buy’ recommendations, go to the Top REITs Quant Screener. This screener automatically highlights the best-ranked quant stocks. You can also filter by multiple metrics to pinpoint the most suitable stocks for your investing strategy.
The brains behind the system
In December 2018, Seeking Alpha acquired CressCap Investment Research, a platform providing next-gen quant analytics. Founder and CEO, Steven Cress, joined Seeking Alpha as Head of Quant Strategies to oversee analytical strategies and quant products for Seeking Alpha clients. Seeking Alpha now provides subscribers with these next-gen quant analytics tools on a user-friendly platform.
FAQs
-
The addition of the REIT sector now means Seeking Alpha provides quantitative ratings on stocks in all 12 GICS sectors. Historically, investors have had to view numerous data vendor platforms to compile relevant REIT financial data to make their investment decisions. In an effort to improve a REIT investor’s research process Seeking Alpha’s quant team has aggregated REIT financial metrics onto our platform. Within investment style groups, we have added many REIT centric metrics such as FFO, AFFO, FAD, and many types of REIT multiples and payout ratios. Notably, we have also taken the step to interpret the data points with our quant factor scores and grades to help our subscribers determine how strong or weak a REIT stands compared to the overall REIT sector.
Our objective is to empower our analysts and subscribers with a unique, REIT centric user-experience that provides an instant characterization of each REIT’s financial metrics.
Seeking Alpha’s REIT Quant Ratings and Factor Grades are an objective, unemotional evaluation of each REIT based on data, such as the company’s financial statements, the stock’s price performance, and analysts’ estimates of the company’s future revenue, earnings, FFO, and AFFO data. Over 100 metrics for each REIT are compared to the same metrics for other REITs. To do this, we compare the relevant metrics for the factor in question for the stock to the same metrics for the other stocks in its sector. The factor is then assigned a grade, from A+ to F.
-
Backtesting reveals how well a specific trading strategy would have performed in the past using historical data. The backtest and model is not an investable product as it only reflects the strategy’s historical performance - but it does let you analyze risk and past profits before allocating real capital. Typically, a full stock market cycle is 4-5 years.
The backtesting proves the effectiveness of our trading methodology employing ‘Strong Buy’ REITs.
Seeking Alpha’s Strong Buy REIT performance is based on a backtested hypothetical portfolio of all the daily ‘Strong Buy’ ratings for 10 years from 31 October 2016 to October 2022.
-
Seeking Alpha's Strong Buy REIT recommendations are generated daily by a systematic quantitative model with no human intervention. The backtested return does NOT reflect an actual portfolio from an investment product. The return is from a backtested hypothetical portfolio consisting of all the REITs on a daily basis ranked as Strong Buy by Seeking Alpha from the time period of 10/31/2016 to October 2022.
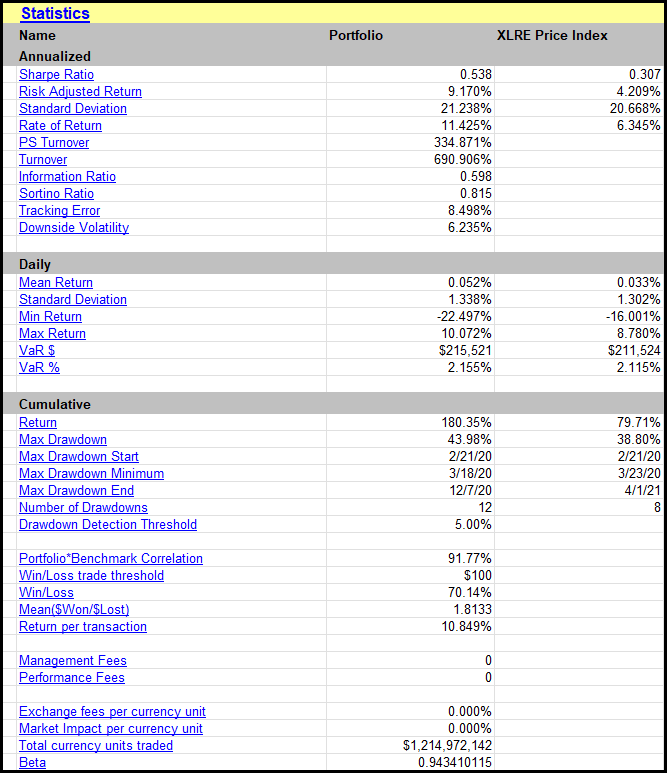
Seeking Alpha's Strong Buy REIT recommendations are equally weighted, inclusive of paid dividends, rebalanced daily, with zero transaction costs. Commission and transaction cost would lower the return of an actual portfolio. Seeking Alpha backtested trades were uploaded to a portfolio and performance attribution system owned by S&P CapIQ. The returns are generated and calculated by S&P CapIQ portfolio and performance attribution system. The benchmark in this table is the Real Estate Select Sector SPDR ETF (XLRE). The XLRE returns in this table are for the identical time period covering 10/31/2016 to October 2022.
*Past performance is no guarantee of future results. Therefore, you should not assume that the future performance of any specific investment or investment strategy will be profitable or equal to corresponding past performance levels. Inherent in any investment is the potential for loss. This material is being provided for informational purposes only and nothing herein constitutes investment, legal, accounting or tax advice, or a recommendation to buy, sell or hold a security. No recommendation or advice is being given as to whether any investment is suitable for a particular investor. It should not be assumed that any investments in securities, companies, sectors or markets identified and described were or will be profitable. Seeking Alpha is not a fiduciary by virtue of any person’s use of or access to the website. You alone assume the sole responsibility of evaluating the merits and risks associated with the use of the information on the website before making any decisions based on such information or other content. Any views or opinions expressed may not reflect those of the firm as a whole. Seeking Alpha is not a licensed securities dealer, broker or US investment adviser or investment bank.
Key Performance and Portfolio Attributions Statistics September 30, 2016 to April 8, 2026.
-
A (REIT) is a real estate company that is similar to a stock and offers common shares. However, a REIT has unique features that make it different than most common stocks. REITs are dividend-paying stocks that focus on real estate. As dividend-paying stocks, REITs are analyzed in a similar fashion to other stocks, but there are big disparities in their analysis that can be attributed to the accounting treatment of property. Seeking Alpha has developed Quant Ratings and Factor Grades that are specific to financial metrics for REITs.
Seeking Alpha’s REIT Quant Ratings Factor Grades provide investors with a directional recommendation an instant characterization of the strength and weakness of a REITs financial metrics. This makes it easy to find or rule out REITs based on your investment criteria.
For investors wanting to do more research, the Quant Ratings and Factor Grades provide a springboard for further research. You can quickly see where a REIT is strong or weak, and with one click you can view the underlying data and sector averages to perform your own evaluation.
-
Seeking Alpha's Quant Ratings and Factor Grades are designed and managed by Steve Cress. Steve has 30 years of experience in equity research, quant strategies and risk management, and founded quant hedge fund Cress Capital Management. Steve is now Seeking Alpha's Head of Quant Strategy.
-
The REIT Quant Ratings and Factor Grades are appropriate for both short and long term investors. The Value, Growth and Profitability factors identify mis-priced securities, and the Momentum and Analysts Revisions factors identify timeliness. Timeliness isn’t only for short term investors. Even deep value investors are aware that securities can remain mis-priced for long periods of time without a catalyst. The overall Quant Rating therefore attempts to identify mis-pricing and timeliness in a single rating, and that’s actionable for both long term and short term investors.
-
Once per day, before the market opens.
-
REIT Grades and Quant Ratings and Factor Grades appear on the stock screeners, the individual symbol pages, and the financial pages. They are only available for Premium subscribers or individuals in a free trial.
To see the ratings on the symbol pages:
(1) Ensure you are logged in to the desktop website or mobile app as a paying subscriber or in the free trial,
(2) Enter the stock symbol in the search box at the top of the page,
(3) Hit Return,
(4) When you land on the symbol page, you'll see the Quant Rating and Dividend Grades on the right-hand column.
-
Seeking Alpha’s Head of Quant Strategies, Steven Cress, has over 30 years of experience in equity research, quantitative strategies and risk management. He runs a team of quantitative analysts at Seeking Alpha that maintain the system on a daily basis.
-
Survivorship Bias: This is when a stock has been delisted or acquired and is not included in the backtest results. As of May 3, 2020, we have eliminated to the best of our ability the survivorship bias from the end of 2009 to the present by adding all stocks that were delisted or acquired to the backtest through data from S&P Global.
Restatement Bias: This is when a company restates its historical financials. We have eliminated to the best of our ability all of the restatement bias from backtesting through S&P Global data.
Split Bias: This is when a company has had a historical stock split. We have adjusted to the best of our ability stock splits from 5 June 2010 - to date using S&P Global data.
Look Ahead Bias: This is when a company reports its financials at a point that was after or not available at the end of the quarter. We have eliminated the Look Ahead Bias to the best of our ability with S&P Global data.
Portfolio Reconciliation: Audit of portfolio performance and portfolio attribution to ensure the data reflected is as accurate as possible. Monthly audits are conducted on backtesting and simulated trades.
-
Seeking Alpha data is sourced from S&P CapIQ and Compustat. The backtesting tool is ClariFi, which is also owned by S&P CapIQ. Both of these entities are fully owned by S&P Global.
Disclaimer: Past performance is not guarantee of future results
Past performance is no guarantee of future results. Therefore, you should not assume that the future performance of any specific investment or investment strategy will be profitable or equal to corresponding past performance levels. Inherent in any investment is the potential for loss. This material is being provided for informational purposes only and nothing herein constitutes investment, legal, accounting or tax advice, or a recommendation to buy, sell or hold a security. No recommendation or advice is being given as to whether any investment is suitable for a particular investor. It should not be assumed that any investments in securities, companies, sectors or markets identified and described were or will be profitable. Seeking Alpha is not a fiduciary by virtue of any person’s use of or access to the website. You alone assume the sole responsibility of evaluating the merits and risks associated with the use of the information on the website before making any decisions based on such information or other content. Any views or opinions expressed may not reflect those of the firm as a whole. Seeking Alpha is not a licensed securities dealer, broker or US investment adviser or investment bank.